Breakout before the click
- Published
- Last updated
- Written by
- launchtube
On the two channels where a winner and a loser could both be measured, the public replay curve did not tell them apart: the two curves came out at 0.722 and 0.720, across 39 videos, on 15 September 2026. What separates a breakout from a flop therefore sits before the click — the title, the thumbnail and the subject. The inside of a video is where a viewer is kept, not where one is won.
What the replay curve is, and what it is not
The public most-replayed heatmap is the only per-video shape YouTube shows the outside world. It is a curve of replays normalised to a video’s own mean, re-normalised again before it is used here. It is not a count of how many people stayed or left, and no such count is public for a channel launchtube does not own.
That limitation shapes everything below. Videos that flopped usually carry no heatmap at all, because they lack the watch volume to generate one, so the shapes available for study are mostly the shapes of videos that already did well. Ninety-two videos across eleven channels had a usable one. The rest of what these measures miss is set out in how growth was measured.
Where a video’s replay curve first drops
The first sustained drop is the second at which replay mass first falls below the video’s own mean. It moves with the length of the file: six seconds on a Short, nine at three to eight minutes, sixteen at eight to twelve, twenty-three at twelve to twenty, and 136 seconds on files over twenty minutes.
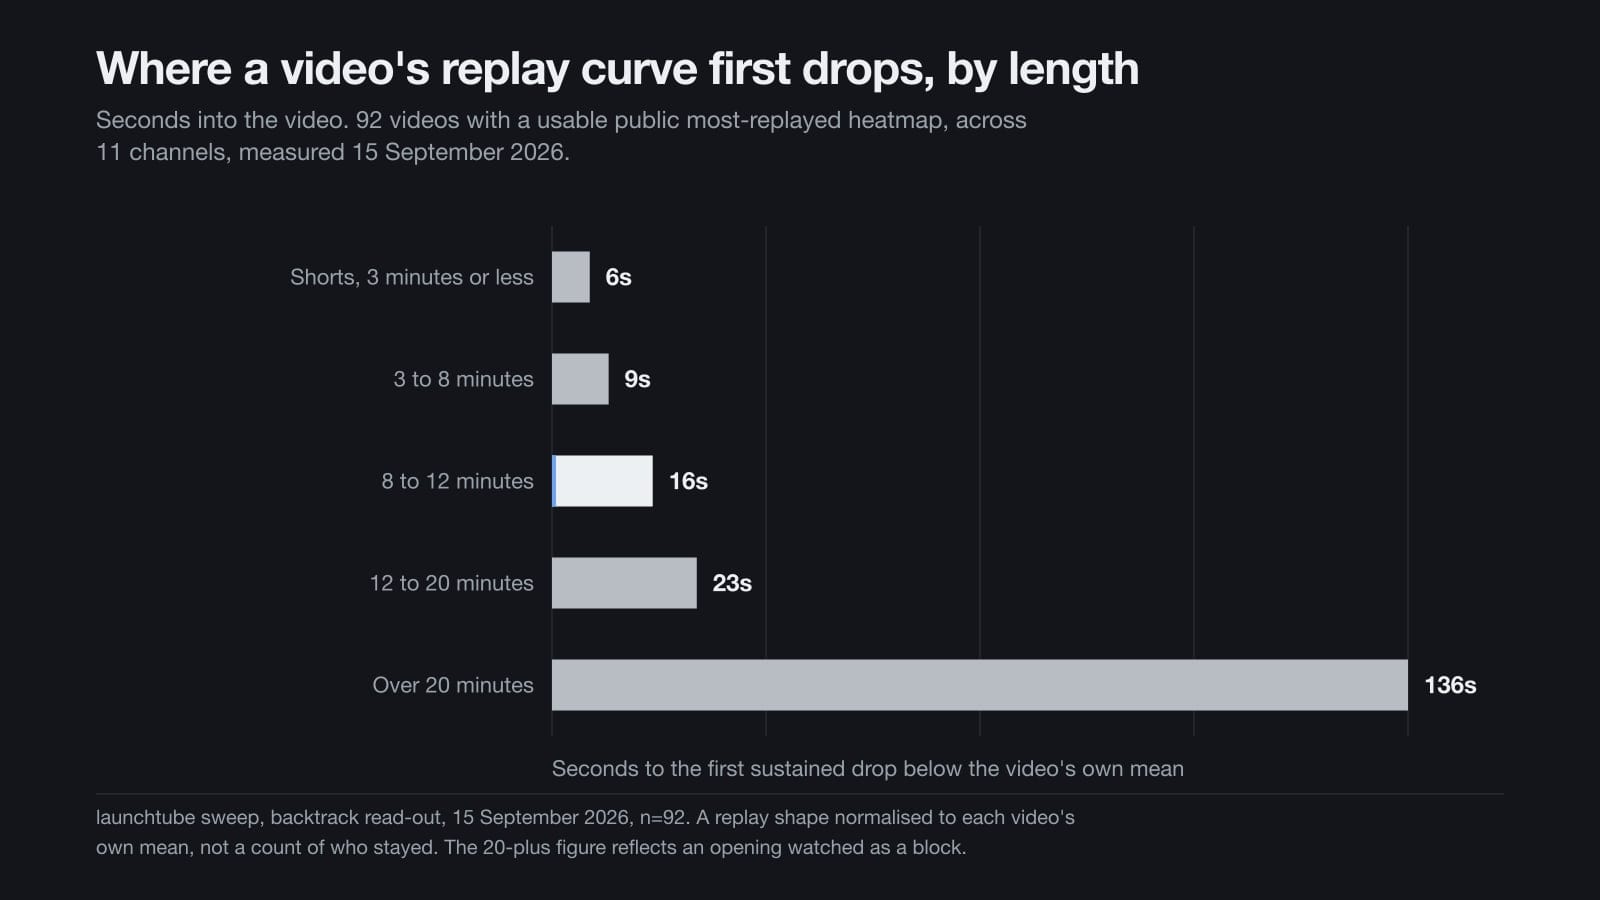
| Length band | First sustained drop | Counted over | What it shows, and does not |
|---|---|---|---|
| Shorts, 3 minutes or less | 6 seconds | 8 Shorts with usable heatmaps | On a 25 to 40 second Short all of the replay mass sits inside the first minute, which is near-tautological; the load-bearing part is the drop at second six. |
| 3 to 8 minutes | 9 seconds | Part of the 92 | A band position, not a per-band verdict: the report gives one figure for the band, not a spread. |
| 8 to 12 minutes | 16 seconds | 17 videos, split 9 against 8 | The best performers hold to second 13 and the weakest drop at second 26; the source report calls that split indicative rather than settled. |
| 12 to 20 minutes | 23 seconds | Part of the 92 | Later than the shorter bands, on the same measure and the same date. |
| Over 20 minutes | 136 seconds | Part of the 92 | It reflects an opening watched as a block, not a hook that runs for two minutes. |
The bands themselves are the subject of the page on video length, which is where the question of which runtime grew is answered. The figures here say only where in a file the replay shape turns down, on the videos that had a shape to read.
Why the first drop does not decide the breakout
A winners-against-losers comparison was possible on only two of the eleven channels with reconstructed histories. On one of them the winning and losing curves were 0.722 and 0.720 — a gap of two thousandths across 39 videos. The replay shape does not predict which video breaks out.
That is a narrow finding and it should be read narrowly. It argues against spending review effort on mid-video structure in the hope of buying a breakout. It does not say structure is irrelevant to a viewer who has already clicked, and the ledger records that limit alongside the number.
How early a breakout arrives, and on whose traffic
On every channel whose history could be reconstructed, the first real break came within the first five uploads rather than later. The research tags that as an inference rather than a measurement, because it rests on reconstructed histories and one catalogue turned out to be missing roughly fifty early uploads.
The dated numbers behind it are unambiguous. One channel’s first and third uploads took 151,064 and 383,127 views while it held 53 subscribers or fewer. On two other channels the second upload took 667,660 views at about 2,700 subscribers, and the third took 966,442 at about 12,800.
The reading the research puts on that is also an inference: early breakouts arrive on browse and suggested traffic, which is independent of how many subscribers a channel has. The counter-case is the one the sweep can show plainly — the channels that needed twenty to fifty uploads to reach a first 100,000-view video were all still small at the time of measurement. What the fastest-growing channels were publishing while that happened is in what grows a faceless channel.
The title patterns the sweep counted
Titles were counted in one field only: the forty most-viewed videos pooled from a 200-video sample of the AI-automation niche, on 15 September 2026. A number in the title appeared in 31 of the 40, the single figure that two separate counts of the same pool agree on.
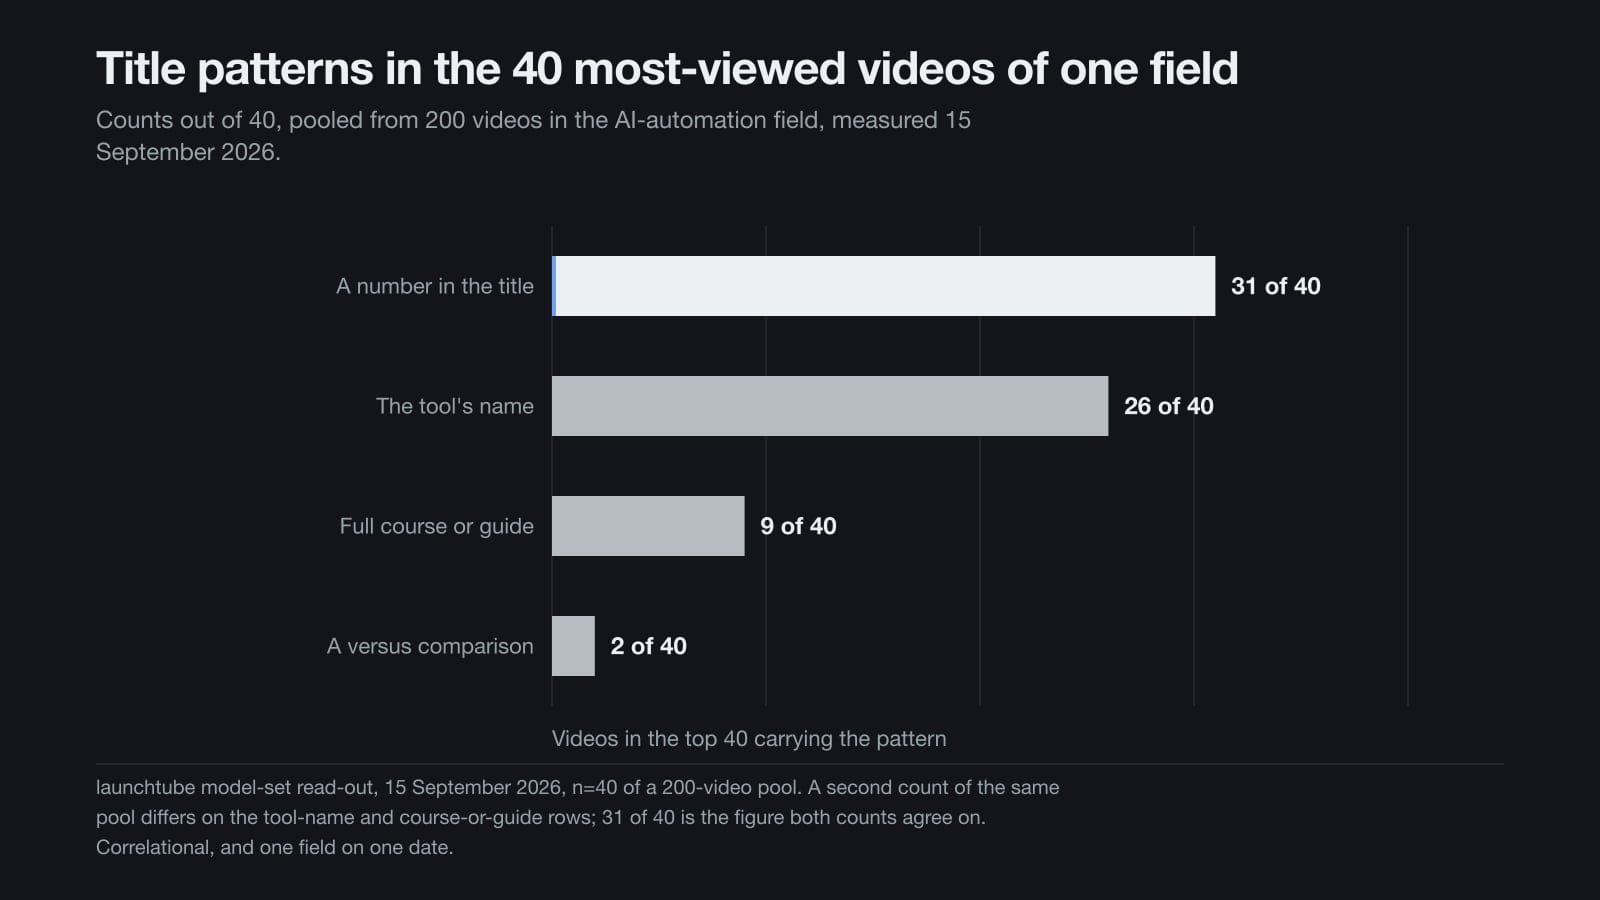
| Pattern | Count | How firm |
|---|---|---|
| A number in the title | 31 of 40 | Both counts of the pool agree on it. The safe figure. |
| The tool’s name | 26 of 40 | The strongest single pattern measured, but a later count of the same pool gives 28, so it is quoted as approximate. |
| A full course or a guide | 9 of 40 | The second count gives 13. Disputed, and stated here as the measurement of record rather than as exact. |
| A versus comparison | 2 of 40 | Too thin for any verdict at all. |
Every one of these is correlational. They are the titles that happened to be on the winning videos of one field on one date, and the field’s own winning content is screen-recorded software, which a generated pipeline cannot make.
Titles that name a thing rather than a category
Across the other classes swept, the pattern that repeats is naming: a specific entity, a specific place and period, or a definition, in place of a category word. The multipliers below are each a video’s views against its own channel’s rolling median, so they compare a video with its channel and not with YouTube.
| Lever | What was measured | Counted over | The caution |
|---|---|---|---|
| A definitional title | A plain “what is X” title ran at roughly three times its channel’s baseline, at a median of 3,398 views against about 1,100 to 1,290 for the rest of that channel’s long form | 18 titles, on a channel of about 3,600 subscribers | A small absolute base, and measured on a presenter-led channel. |
| The same title in the viewer’s own language | 1.37 million views on one Spanish Short, 548,000 in French and 497,000 in Italian, against an English-only median of about 155 to 164 views | One channel, Shorts median about 190 views | Outliers, not typical outcomes. The finding is that language coverage produced them, not the format. |
| An era and a place, with a generic role | Eight of the ten biggest breakouts on the cinematic reconstruction channels were era-and-place titles built on generic roles rather than named people | Top ten by multiplier on one channel | The remaining two involve a named monarch and a real dated disaster, which are exactly the cases that carry disclosure and real-person risk. |
| The same, by size | 57 times baseline for pirates in 1715, 23 times for Victorian debutantes in 1888, 14 times for the Dark Ages in 900 AD | Single videos on a young channel | A thin baseline inflates a multiplier, and the channel was down 90 per cent from its peak when it was measured. |
| A named folklore entity | Named entities beat generic horror titling on the same channel by 1.7 to 2 times: 1.36 and 83,652 median views against 0.78 and 26,262 | 64 named against 67 generic on one channel; 20 against 72 on a second | Both channels were dormant when measured, and the premium had decayed by 2025. |
| Encyclopedic framing | Lineups of the kind “every god of X” ran at 3.02 and cross-pantheon comparisons at 3.75, against 0.19 to 0.58 for single-story narratives | 9 lineups and 6 comparisons on one dormant channel | The review found the six pooled two Shorts with four long videos, which inflates the figure, and the format exhausted itself within about ten months. |
Which of those subjects a generated pipeline can actually render, and which classes returned nothing at all, is the subject of the page on niches.
What the strongest thumbnails in the genre have in common
This one is an inference from the files rather than a measurement. Across three separate reports, the best-performing thumbnails inspected carried heavy baked-in text and several characters in frame, which is the opposite of what a one-character-per-shot generated pipeline produces.
It was thumbnail inspection on small samples, not a systematic study, and it describes what the field does rather than proving that text-heavy thumbnails cause the views. Treated as a description of the competitive shelf, it is still the most concrete thing the sweep recorded about the picture a reader sees before deciding.
The opening seconds, for a viewer who has already clicked
On the reference channels measured, the subject of the video is named in the first two to fifteen seconds and the payoff is promised before the body begins; on one set of references the definition itself is answered by about second 31. That is directional structure drawn from auto-captions of three to five top videos per channel, not a tested rule.
On a Short there is less room than that. The first sustained drop arrives at second six, and on a 25 to 40 second file all of the replay mass sits inside the first minute, so the subject has to be on screen before anything else is.
What this page does not claim
No figure here states how many people clicked, how long they stayed, or what any channel made. None of that is public for a channel launchtube does not own, and the public replay heatmap is the ceiling of what can be seen from outside. Whether the way a video is made affects its reach is a separate question, answered from YouTube’s own published pages in does YouTube penalise AI channels.
The title levers carry one more caution, and the research tags it as speculative: every one of them in the two fields with no generated channel in them was measured on presenter-led channels, and nobody has run them on a faceless generated channel, because none exists in either field. The levers are real where they were measured. Whether they transfer is untested, and this page does not pretend otherwise. The rest of the research sets out the same limits for the other five questions.
How this was measured
Discovery ran on 15 September 2026: 36 search.list calls against the YouTube Data API, three content phrasings for each of twelve content classes. That returned 302 unique channels. A mechanical filter — 40 or more uploads, 5,000 or more subscribers, under 60 months old — left 35 candidates.
Each candidate was taken apart upload by upload. Uploads under 28 days old were excluded, because they have not finished collecting views. Shorts of three minutes or less were counted separately from long form. The outlier multiplier for an upload is its views divided by the median views of its neighbours in the same format bucket, which measures a video against its own channel rather than against YouTube. The trailing form, which divides by the previous ten uploads only, is the primary measure, because it divides by uploads that already existed when the video was published; the centred form, which divides by the ten before and the ten after, is a secondary reading and is biased against early uploads.
Three phrasings per class is thin. Two classes were re-swept with fresh phrasings and both changed their answer, so a class with no qualifying channel is under-sampled rather than empty. Subscriber counts are a single snapshot. Click-through, retention and revenue are not public for any channel launchtube does not own, so no figure on this page states them.
The replay figures on this page come from the public most-replayed heatmap, which is a shape normalised to each video’s own mean and re-normalised again before use. It is not a count of who stayed and who left, and no such count is public for a channel launchtube does not own. Ninety-two videos across eleven channels had a usable heatmap; videos that flopped usually have none, because they lack the watch volume to generate one.
The title counts are pooled from the forty most-viewed videos of one field, out of a 200-video sample taken on 15 September 2026. A second count of the same pool differs on two of the four rows, and the page says so where it quotes them. Every title figure here is correlational: it describes the titles on the videos that happened to win, in one field, on one date.
What this page does not show: the replay shape is not retention and not a count of anyone leaving, the winners-against-losers comparison was possible on only two of eleven channels, and the title levers were all measured on presenter-led channels in fields with no generated channel in them, so whether they transfer is untested and tagged speculative. No figure here states click-through, retention or revenue, because none of those is public for a channel launchtube does not own.
Questions people ask
Does the replay curve show which video will break out?
No. On the two channels where hits and flops could both be measured, the curves sat almost on top of each other, at 0.722 against 0.720 on one of them, across 39 videos on 15 September 2026. The curve describes the shape of replays inside a video. It does not separate the videos that won from the ones that did not.
How quickly does a short video’s replay curve fall?
At about second six. Across the eight Shorts with a usable heatmap, the first sustained drop below the video’s own mean came at second six, and on a 25 to 40 second Short all of the replay mass sits inside the first minute. It marks where replay mass falls below the mean; it is not a count of how many people left.
What title patterns did the sweep count?
In the 40 most-viewed videos of one field on 15 September 2026, a number appeared in 31 titles and the tool’s name in 26. A full course or guide appeared in 9, and a versus comparison in only 2. A second count of the same pool differs on the middle two rows, so 31 of 40 is the one figure quoted as firm.
How early does a new channel’s first breakout arrive?
Within the first five uploads on every channel whose history could be reconstructed. One channel’s first and third uploads took 151,064 and 383,127 views while it had 53 subscribers or fewer, and the channels that needed twenty to fifty uploads to reach a first 100,000-view video were all still small at the time of measurement.
Can these title patterns transfer to a faceless channel?
Nobody knows. Every title lever measured in the two fields with no generated channel in them was measured on presenter-led channels, and nobody has run them on a faceless generated channel because none exists in either field. The research tags that transfer as speculative, and so does this page.
What does this page deliberately not measure?
How many people clicked, how long they stayed, and what any channel made. None of it is public for a channel launchtube does not own, the public replay heatmap is the ceiling of what can be seen from outside, and the sweep collected none of the rest.
Sources and further reading
What this page is built from
- 17a — proof-channel sweep read-out — 302 channels discovered, 35 through the filter, 12 content classes
- 17 — proof channels plan, §4.1 qualification rules — the rules a channel had to meet to be torn down
- 17a — backtrack read-out: growth histories, replay heatmaps and comment timelines — 92 videos with a usable heatmap across 11 channels; a winners-against-losers comparison possible on 2
- 17a — model-set read-outs for the two fields with no generated channel in them — 40 titles pooled from a 200-video sample; 18 titles on a second channel
- 17a — adversarial review of the shortlist, twelve objections verified against the CSVs — the 10 largest breakouts on one reconstruction channel
The authorities this page draws on
- Top ways to ensure your content performs well in Google's AI experiences Google Search Central, last updated
- Disclosing use of GenAI content YouTube Help
- YouTube Partner Program overview & eligibility YouTube Help
- Wayback Machine, used to date a channel’s earlier titles and descriptions Internet Archive
- Add custom thumbnails on YouTube YouTube Help
- Get started creating YouTube Shorts YouTube Help
- YouTube performance FAQ and troubleshooting, on impressions and traffic sources YouTube Help
About this research
launchtube runs and publishes this research itself. It is one company's measurements of public YouTube channels, taken on a stated date with a stated method, and it is written by launchtube rather than by any named individual. Where a number cannot be traced to a file it is removed, not softened, and where the data cannot answer a question the page says so.
Every research page, and what launchtube does with it.
Add launchtube as a preferred source in Google