How to measure YouTube channel growth
- Published
- Last updated
- Written by
- launchtube
Growth on a channel you do not own has to be measured against the channel itself, because the only figures that are public are views, subscribers and the dates attached to them.
The measure used throughout this research is the outlier multiplier: an upload's views divided by the median views of its neighbours. The primary version of it divides by the ten uploads before, not by a window centred on the upload, and recomputing the stored figures reproduced them to a median absolute difference of 0.003 across 146 videos on 16 September 2026.
What the outlier multiplier is
The outlier multiplier is a video's views divided by the median views of the uploads around it in the same format bucket, so it measures a video against its own channel rather than against YouTube. It normalises out how big the channel was and what year it was, which is what makes two videos on two different channels comparable in shape. It cannot compare them in absolute terms, and it needs ten neighbours on each side to be stable.
In words: take the upload, take the uploads either side of it in the same bucket, find the median of their views, and divide. Written out, the centred form is m = V(i) ÷ median(V(i−10) … V(i−1), V(i+1) … V(i+10)) and the trailing form is m = V(i) ÷ median(V(i−10) … V(i−1)). A multiplier of 1.00 is an upload that did exactly what the channel was already doing. Shorts of three minutes or less sit in their own bucket and are never pooled with long form.
The three normalisations, and which one is primary
Three ways of picking the denominator were tried, and they do not agree. The trailing multiplier is the primary measure, because it divides only by uploads that already existed when the video was published. The centred one is kept as a secondary reading. The third, views per thousand subscribers, was tested and set aside.
| Normalisation | What it divides by | Status | The limit on it |
|---|---|---|---|
| Trailing median | The previous ten uploads in the same format bucket | Primary | Noisier early in a catalogue, where fewer than ten prior uploads exist |
| Centred rolling median | The ten uploads before and the ten after | Secondary | Biased against early uploads, which have no left-hand neighbours |
| Views per thousand subscribers | The channel's subscriber count at the time | Not used across years | Dominated by the channel's time trend, so comparable only within one year |
Views per thousand subscribers looks like the obvious fix for channel size, and it is not. On one catalogue the measure ran from 15,855 down to 515 over the channel's life, which is a time trend rather than a quality signal, and it is unusable altogether on channels with only two archived subscriber snapshots. That does not make subscriber normalisation worthless; it makes it a within-year measure.
Why the centred window is biased against early uploads
A centred window looks ten uploads into the future. Early in a catalogue there is no past to look at, so the denominator is made almost entirely of later, larger uploads, and the earliest videos are scored against a channel they helped build. Correcting for that does not shade the verdicts; it changes them.
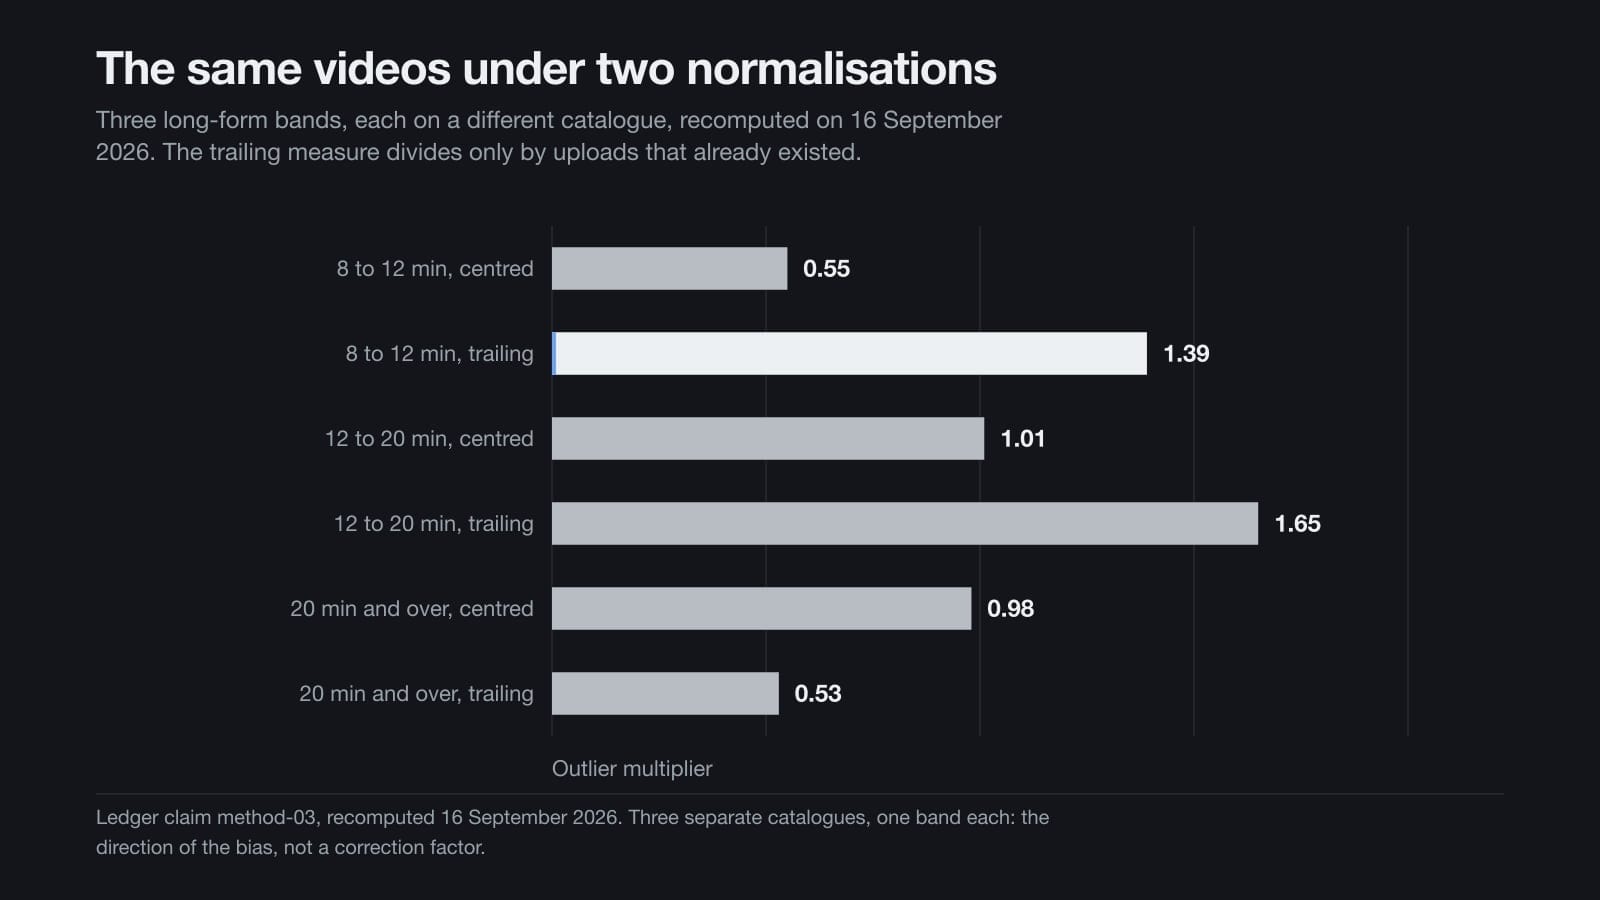
Re-running the same videos under the trailing measure moved an 8 to 12 minute band from 0.55 to 1.39 on one catalogue, a 12 to 20 minute band from 1.01 to 1.65 on another, and a band over 20 minutes from 0.98 down to 0.53 on a third.
Those are three different channels, one band each, and they show the direction of the bias on those catalogues rather than a correction factor anybody can apply elsewhere. The consequence for reading a length verdict is set out on the page on video length, where one of those reversals decides the argument.
There is a second reason a band verdict near the start of a catalogue cannot be trusted. Early uploads are both short and early, so runtime and channel era are entangled: on one 146-upload catalogue the median position of an 8 to 12 minute video was 29 and the median position of a video over 20 minutes was 93. Nothing in this method separates the two, and that is a reason to distrust the verdict rather than a measurement of how big the bias is.
Age-matched cohorts, and why a cohort test needs a control
Views accumulate for as long as a video exists, so a video uploaded two years ago has had two years to collect them. Compare any group of recent uploads with any group of older ones and the recent group loses. Every group declines on this metric, which means a cohort test without a control group prices in nothing and proves nothing.
The fix used here is two-part. Uploads are compared by how old they are, quarter by quarter, never by calendar date alone.
And a control group of presenter-led and real-footage channels carries the age bias alongside the group being tested, so only the difference between the groups is load-bearing; the absolute decline figures are overstated in every group. Residual age bias remains even then, and it favours older quarters, which understates the direction of a decline and overstates its size. What that test found about generated channels is on its own page.
Survivorship, and what a sweep of visible channels cannot see
Every channel in this research was found by searching for it, which means every channel in it was already big enough to be found. Discovery ran 36 channel queries, surfaced 302 unique channels and reduced them to 35 candidates on mechanical criteria — 40 or more uploads, 5,000 or more subscribers, under 60 months old — before any judgement was applied.
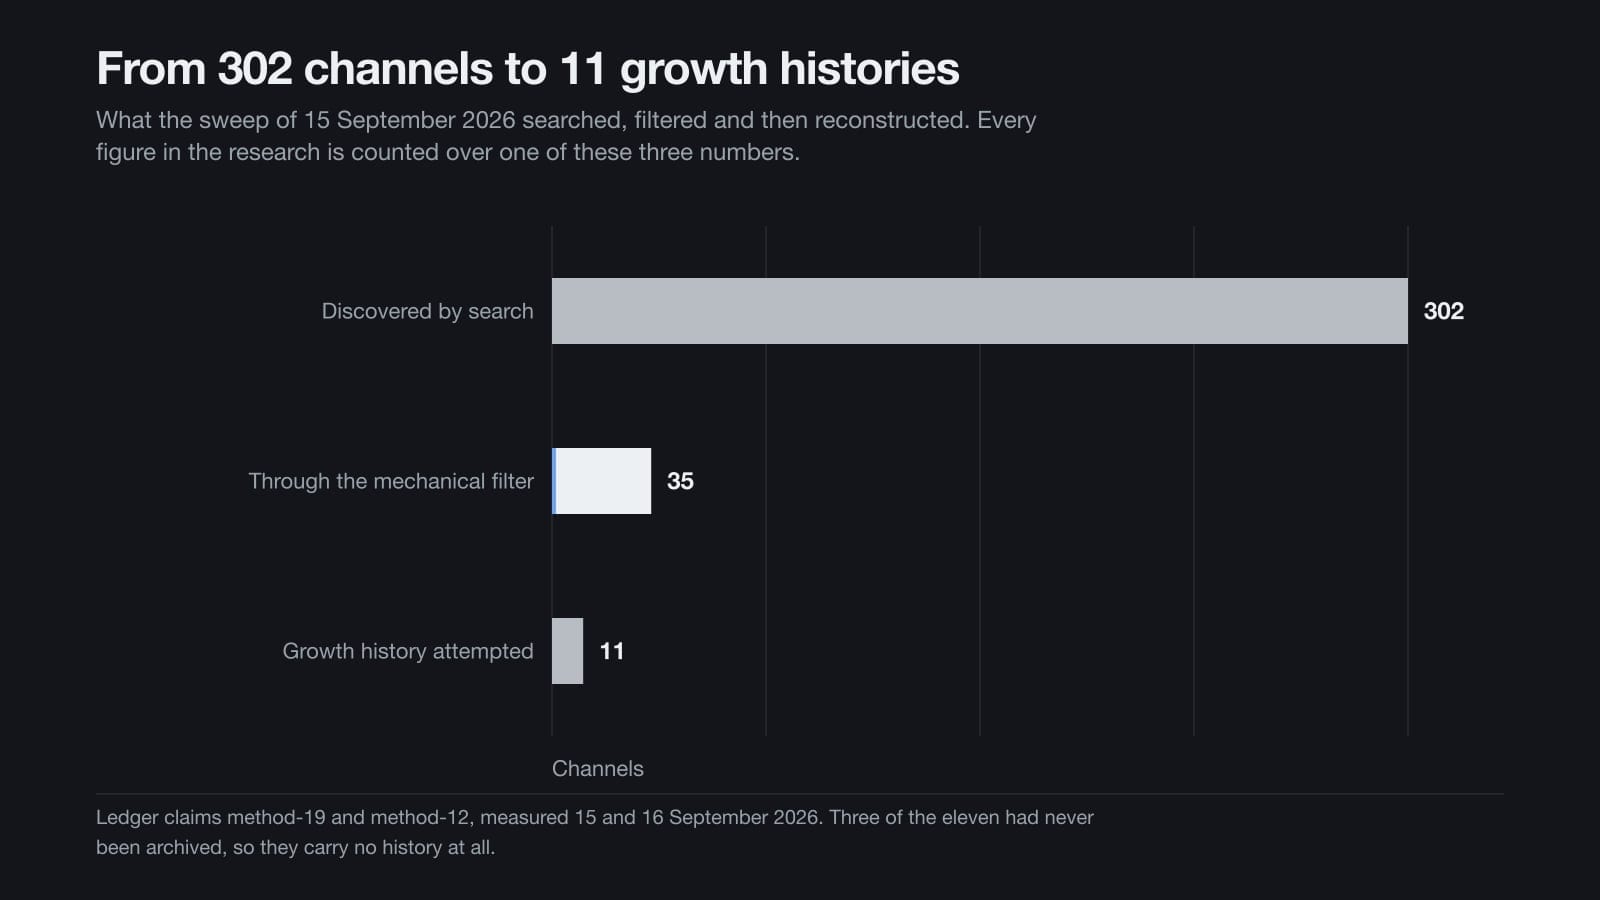
That filter is the survivorship. A channel that published forty videos and never reached the five-thousand-subscriber floor is invisible here, so nothing in this research can say how often a format fails. Three phrasings per class is also thin: two of the twelve classes were re-swept with fresh phrasings and both changed their answer, which is why an empty class is reported as none found in this sample rather than none exist.
The same effect runs one level down, inside a channel. Videos that flopped usually have no public replay heatmap at all, because they lack the watch volume to generate one — on nine of eleven channels there were no heatmaps on the weaker videos to compare against. Any heatmap-based comparison is therefore biased toward a channel's better-watched videos before it starts.
And subscriber-per-month figures here are lifetime averages from a single snapshot of 183 channels rather than growth velocity, so a channel that grew fast and stalled reads the same as one growing steadily.
The public replay heatmap is a replay shape, not retention
The graph that appears above a YouTube progress bar is the most commonly misread number in this genre. It is a replay shape, re-normalised here to a mean of 1.0 before use, and it was usable on 92 videos. It shows which parts of a video get replayed relative to the rest of that same video. It is not audience retention, it cannot be compared across videos in absolute terms, and it says nothing about how many people finished.
That distinction is not a technicality, because the ceiling is real: no free per-video retention data exists for a channel you do not own, and the public replay heatmap is as far as the public data goes. Retention, click-through and revenue figures are simply not public for other people's channels, so no number of that kind appears anywhere in this research.
Read as what it is, the heatmap also turns out not to answer the question people ask of it. Across 39 videos with usable curves it did not separate a channel's hits from its flops — on one channel the winning and losing curves sat at 0.722 and 0.720 — which is the evidence that the breakout is decided before the click. Only two of eleven channels had enough replay data to make that comparison at all, and the page on breakout takes the finding further.
The data sources, and the limit each one carries
The whole study rests on public data: channel and video statistics, archived channel pages, auto-captions, public replay heatmaps and comment timelines. No private analytics were used and none were available, so the absence of click-through, retention, revenue and traffic-source figures is by design rather than by omission.
| Source | What it gives | The limit on it |
|---|---|---|
| Channel and video statistics | Views, subscribers, upload dates, runtimes | One snapshot, taken 15 September 2026 across 183 channels |
| Archived channel pages | Subscriber history, earlier titles and descriptions | Coverage is uneven: 38 snapshots for one channel, two for others, and three of eleven channels were never archived at all |
| Public replay heatmap | Where a video is replayed, relative to itself | Usable on 92 videos, and absent on most weaker uploads |
| Comment timelines | When a video was being watched | Comments land a median 27 days after upload, so the most recent months are understated |
| Auto-captions and thumbnails | Subject, structure and format judgements | Several judgements were made without watching the videos in full, and each report says which |
Growth histories were reconstructed from three of those sources together — archived channel pages, the replay heatmap and dated comment timelines. Where there are no archives there is no history.
Archived subscriber counts are YouTube's own three-significant-figure display strings, accurate to about half a per cent, and milestone dates between two snapshots are interpolated estimates rather than observations, which sets the floor on how precise any subscriber claim can be. The comment timeline works as a proxy because the lag is measurable: 90 per cent of comments land within 64 days and 5 per cent after 90 days.
The rules that keep a number honest
Four rules were applied to every figure. Uploads less than 28 days old were excluded, because they have not finished collecting views, and Shorts of three minutes or less were counted separately from long form throughout — pooling them was a real error found in the review on one class. A cluster of fewer than five videos is never treated as a verdict, and every multiplier verdict carries its n. Small-n figures still appear, flagged as directional rather than removed.
The third rule is that the arithmetic must be reproducible. Recomputing the multipliers from the raw view counts reproduced the stored ones to a median absolute difference of 0.003 across 146 videos, which checks that the numbers on disk can be regenerated without validating the source view counts themselves.
The fourth is that a broken tool is reported rather than quietly fixed. A parser bug was caught during the work: the first version matched the subscriber phrase in a video description instead of the channel header and produced plausible but wrong history, so every shipped row now carries a method column naming the pattern that read it.
One finding came out of those rules and changed a published conclusion. A model channel's public catalogue turned out to be truncated, with roughly fifty early uploads missing, which invalidated a cold-start claim drawn from it. Every other catalogue in the set reconciled to within three uploads, and the rule taken from it is that no band or era verdict may be drawn from a truncated catalogue.
All of it was measured on 15 and 16 September 2026, in one session, from a free quota of 10,000 API units of which 4,974 were used in the first pass. It is a single point in time; channel statistics move daily, and every figure here should be read as at that date. The same caveat applies to every page in this research section, including what grows a faceless channel, which is built on these measures.
How this was measured
Discovery ran on 15 September 2026: 36 search.list calls against the YouTube Data API, three content phrasings for each of twelve content classes. That returned 302 unique channels. A mechanical filter — 40 or more uploads, 5,000 or more subscribers, under 60 months old — left 35 candidates.
Each candidate was taken apart upload by upload. Uploads under 28 days old were excluded, because they have not finished collecting views. Shorts of three minutes or less were counted separately from long form. The outlier multiplier for an upload is its views divided by the median views of its neighbours in the same format bucket, which measures a video against its own channel rather than against YouTube. The trailing form, which divides by the previous ten uploads only, is the primary measure, because it divides by uploads that already existed when the video was published; the centred form, which divides by the ten before and the ten after, is a secondary reading and is biased against early uploads.
Three phrasings per class is thin. Two classes were re-swept with fresh phrasings and both changed their answer, so a class with no qualifying channel is under-sampled rather than empty. Subscriber counts are a single snapshot. Click-through, retention and revenue are not public for any channel launchtube does not own, so no figure on this page states them.
The multiplier on this page has two forms. The trailing form, the primary measure, divides an upload’s views by the median of the previous ten uploads in the same format bucket; the centred form divides by the ten before and the ten after. Recomputing the stored figures from the raw view counts reproduced them to a median absolute difference of 0.003 across 146 videos on 16 September 2026. A cluster of fewer than five videos is never treated as a verdict, and every verdict carries its n.
The limits are the point of the page. The centred window is biased against early uploads; views per thousand subscribers is dominated by a channel’s time trend and is comparable only within one year; the public replay curve is a replay shape re-normalised to a mean of 1.0, usable on 92 videos, and it is not retention. Archived subscriber counts are YouTube’s own three-significant-figure display strings, accurate to about half a per cent, with milestone dates between snapshots interpolated. Comments land a median 27 days after upload, so the most recent months of any comment timeline are understated.
Questions people ask
What is the outlier multiplier?
It is a video’s views divided by the median views of the uploads around it in the same format bucket, which measures a video against its own channel rather than against YouTube. The primary version divides by the previous ten uploads only. A multiplier of 1.00 is an upload that did exactly what the channel was already doing.
Why is the trailing multiplier used rather than a centred one?
Because a centred window looks ten uploads into the future, which scores a channel’s earliest videos against a channel they helped build. Re-running the same videos on the trailing measure moved an 8 to 12 minute band from 0.55 to 1.39 on one catalogue and a band over 20 minutes from 0.98 down to 0.53 on another, so the choice of window changes a verdict rather than shading it.
Is the most replayed graph the same as audience retention?
No. It is a replay shape, re-normalised to a mean of 1.0, showing which parts of a video are replayed relative to the rest of that same video. It was usable on 92 videos, it cannot be compared across videos in absolute terms, and it says nothing about how many people finished. No free per-video retention data exists for a channel you do not own.
How many channels were measured, and when?
Three hundred and two channels were discovered on 15 September 2026 and 35 came through a mechanical filter of 40 or more uploads, 5,000 or more subscribers and an age under 60 months. Growth histories were then attempted on eleven of them, three of which had never been archived. Everything was measured on 15 and 16 September 2026.
Can this method say anything about a channel’s first ten uploads?
Only with care. The trailing multiplier is noisier early in a catalogue, where fewer than ten prior uploads exist, and early uploads are both short and early, so runtime and channel era are entangled. A band verdict drawn from the start of a catalogue is not trusted here.
Does this research use private YouTube analytics?
No. It rests on public data only: channel and video statistics, archived channel pages, auto-captions, public replay curves and comment timelines. Retention, click-through and revenue figures are not public for a channel launchtube does not own, so none of them appear anywhere in this research.
Sources and further reading
What this page is built from
- 17a — proof-channel sweep read-out — 302 channels discovered, 35 through the filter, 12 content classes
- 17 — proof channels plan, §4.1 qualification rules — the rules a channel had to meet to be torn down
- Re-normalisation review — the three normalisations compared and the multipliers recomputed — 146 videos recomputed, median absolute difference 0.003
- Backtrack report — growth histories from archived pages, public replay curves and comment timelines — 11 channels, 92 videos with a usable replay curve, 39 with winner-and-loser curves
- Age-matched cohort test — three groups compared quarter by quarter — generated, presenter-led or real footage as the control, and the shortlist
- Channel snapshot, 22:00 on 15 September 2026 — 183 channels; the single snapshot behind every subscriber figure
- 17a — selection report, §4 measurement rules P18 to P25 — the rules every figure had to pass before it was written down
The authorities this page draws on
- Top ways to ensure your content performs well in Google's AI experiences Google Search Central, last updated
- Disclosing use of GenAI content YouTube Help
- YouTube Partner Program overview & eligibility YouTube Help
- Wayback Machine, used to date a channel’s earlier titles and descriptions Internet Archive
- Use chapters, mentioned people and places, & seeking features — the most replayed graph, and when it is not shown YouTube Help
- Search: list — the YouTube Data API call the sweep’s discovery ran on Google for Developers
- Quota Calculator — what each YouTube Data API call costs against the free quota Google for Developers
About this research
launchtube runs and publishes this research itself. It is one company's measurements of public YouTube channels, taken on a stated date with a stated method, and it is written by launchtube rather than by any named individual. Where a number cannot be traced to a file it is removed, not softened, and where the data cannot answer a question the page says so.
Every research page, and what launchtube does with it.
Add launchtube as a preferred source in Google