What grows a faceless YouTube channel
- Published
- Last updated
- Written by
- launchtube
Every channel that was growing fastest when launchtube swept 302 faceless YouTube channels on 15 September 2026 was publishing pure long form, not Shorts. That is four channels: three had published no Short at all, and the fourth had published one in 62 uploads. It describes those four channels on that date, it does not show that Shorts fail, and it is not a forecast of what any channel will do next.
What the fastest-growing channels published
The read-out records five independent passes over the twelve content classes arriving at the same cross-class finding: the channels growing fastest were long-form channels. The upload mix is the plainest way to see it. Three of the four had never published a Short, and the fourth had published exactly one across 62 uploads. These are public upload counts read on one day, and they say nothing about how those channels would have done with Shorts.
| Channel | Uploads | Shorts | Measured |
|---|---|---|---|
| Sleepy Science Channel | 318 | 0 | 15 September 2026 |
| ExtinctZoo | 150 | 0 | 15 September 2026 |
| Serious History | 62 | 1 | 15 September 2026 |
| Deep Sea Relics | 58 | 0 | 15 September 2026 |
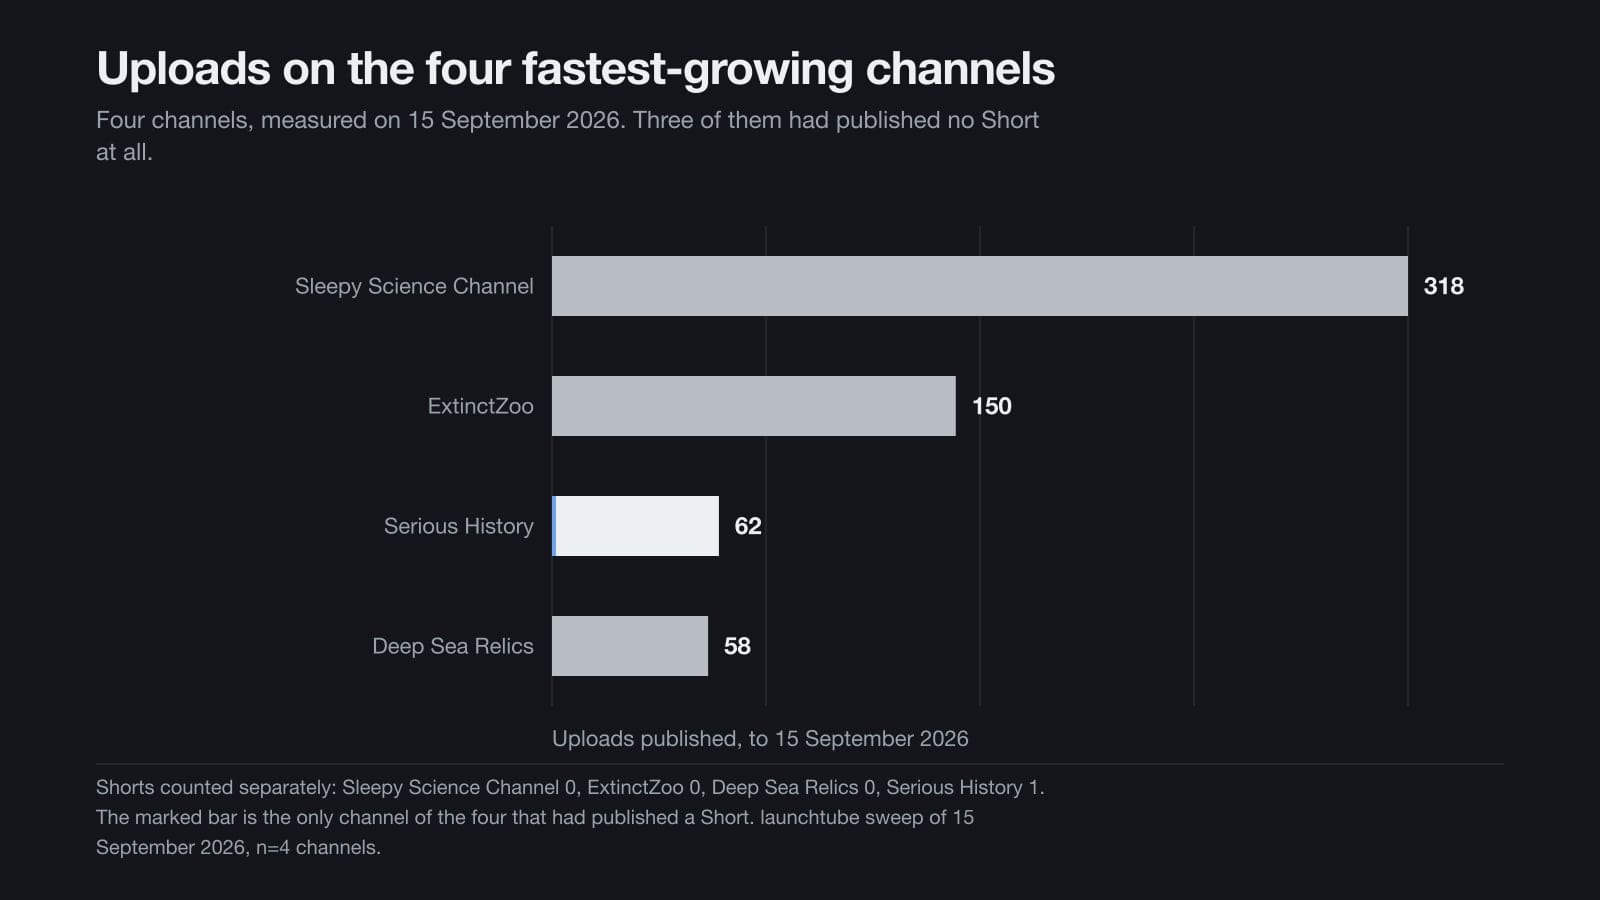
One qualifying channel in the sweep did carry a balanced mix of Shorts and long form, and it was the weakest grower of the set. That is a single channel, so it is a note rather than a finding. What the sweep cannot separate is length from subject: the page on video length sets out how far a runtime verdict can be trusted, and the page on how growth is measured spends as long on what each measure misses as on what it counts.
How soon the first breakout arrived
On every channel where the history could be reconstructed, the first real breakout came within the first five uploads rather than later. This is an inference drawn from five channels that went on to succeed, so it cannot say how often a late-breaking channel exists; it can only say that the early break is what these channels had in common.
| Channel | Upload | Views | Subscribers at the time |
|---|---|---|---|
| Sleepy Science Channel | First | 151,064 | 53 or fewer |
| Sleepy Science Channel | Third | 383,127 | 53 or fewer |
| Serious History | Second | 667,660 | about 2,700 |
| Worlds Before Us | Third | 966,442 | about 12,800 |
Views that far above the subscriber base cannot have come from subscribers, which suggests the early breakouts arrive on browse and suggested traffic — traffic that is independent of how many subscribers a channel has. That is an inference, not a measurement: traffic-source data is not public for a channel launchtube does not own, so the reasoning runs from the gap between views and subscribers rather than from a report.
One claim that did not survive the recompute is worth stating, because it shows the discipline. An earlier reading of the same data said the winner was upload number one. The catalogue it rested on turned out to be truncated, with roughly fifty early uploads missing, so the claim was withdrawn and replaced with the corrected one above: the first real break falls on uploads two to five.
The channels that took longer to break
The counterpart is just as plain. Four channels needed between twenty-one and fifty-two uploads to reach their first video of 100,000 views: ancient editions 21, True Mythology 33, Whispered Realities 38 and Nova’s Lab 52. All four were still small when they were measured. That is a correlation across eleven channels, not a causal rule about posting volume, and it cannot tell a channel owner that upload 40 is too late.
Why the break happens before the click
The public most-replayed curve does not separate a channel’s hits from its flops, which points to the breakout being decided before anyone presses play. Only two of eleven channels had enough replay data for a winners-against-losers comparison, across 39 videos; on one of them the winner and loser curves came out at 0.722 and 0.720.
It shows the replay shape does not predict which video breaks out. It does not show that what happens inside a video is irrelevant to anything else, and the page on breakout before the click sets out where that measure fails.
What a working catalogue looks like
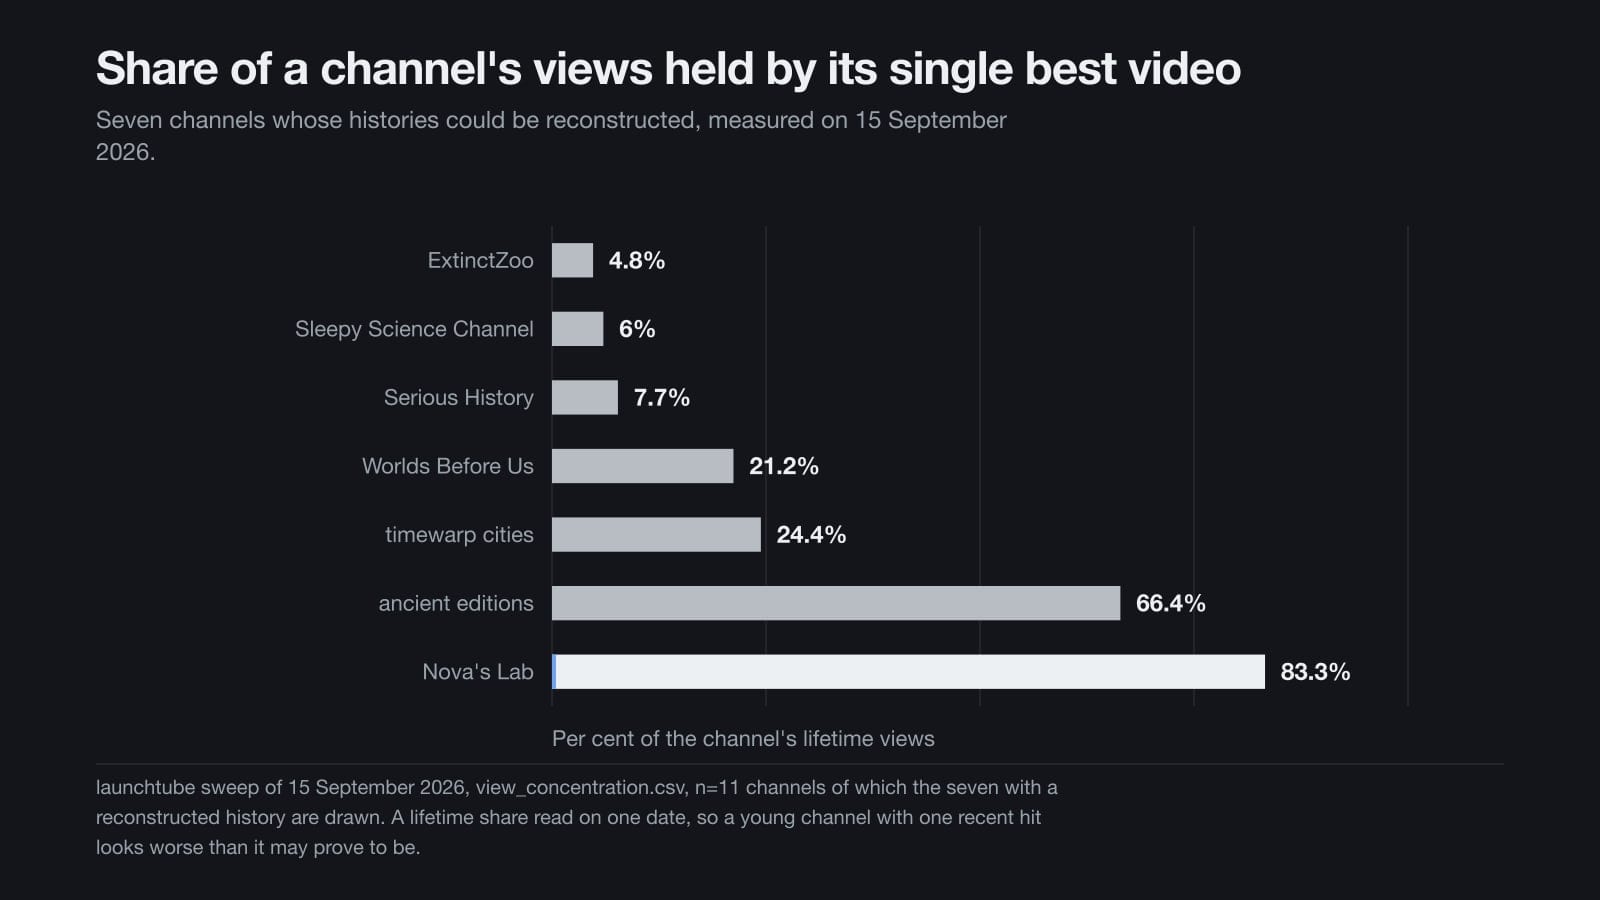
How concentrated a channel’s views are in its single best video separates a real catalogue from a one-hit channel. The broad catalogues in this set sat between 4.8 and 7.7 per cent; the one-hit channels sat at 66.4 and 83.3 per cent. It is a lifetime share read on one date, so a young channel with one recent hit looks worse on this measure than it may prove to be.
| Channel | Share in the best video | Reading |
|---|---|---|
| ExtinctZoo | 4.8 per cent | Broad catalogue |
| Sleepy Science Channel | 6.0 per cent | Broad catalogue |
| Serious History | 7.7 per cent | Broad catalogue |
| Worlds Before Us | 21.2 per cent | Concentrated |
| timewarp cities | 24.4 per cent | Concentrated |
| ancient editions | 66.4 per cent | One-hit |
| Nova’s Lab | 83.3 per cent | One-hit |
What happened after the peak
All eleven shortlisted channels were past their per-video peak and declining when they were measured. Measured decline from peak quarter to latest ran from 54 per cent to 91 per cent across eight of them. Those cohorts are small — thirteen mature uploads on one channel, six on another, two, one and one on three more — and because views accrue with a video’s age the magnitudes are overstated even where the direction is right.
The decline is not the story it first looks like. These eleven were selected precisely because they had peaked, so a fall afterwards is partly regression to the mean rather than evidence that their formats stopped working. Among the generated channels that were not shortlisted, one in four was at its peak when it was measured, seven of twenty-eight.
And presenter-led and real-footage channels in the same niches declined as hard as the generated ones across 63 age-matched channels, so no platform penalty on generated content is visible in this data. That question has its own page, with the cohort test in full.
Posting more often did not rescue a cooling channel. One channel raised its cadence from 1.17 to 1.79 uploads a week while its views per video fell 90 per cent, over six mature uploads in the cohort. It shows cadence did not offset the decline there; it does not prove cadence never helps.
A dated comment timeline confirmed the same decline from a second, independent source. Comments on that channel ran 60, 21, 16, 175, 26, 3, 4 and 1 a month from February to September 2026, across 306 comments on five videos. Comments land a median 27 days after upload, so the last month or two of any such timeline is always understated.
Why the way you search changes the answer
Searching for channels by subject returns real-footage brands, presenter channels and text-carried infographics. Searching by look instead — twelve phrasings describing what a video looks like rather than what it is about — touched 337 channels and found a whole genre that every subject search had missed.
That is a method finding from one night’s searching. It shows subject-first search has a blind spot; it does not quantify how large the blind spot is. The page on niches lists which content classes came back empty and which of those are under-sampled rather than genuinely empty.
What a company-run channel did in the same subject
One brand-run channel was scored against individual creators covering the same subject, on public view counts. It underperformed them by roughly ten to eighteen times. That compares one company channel’s ceiling with single videos from named creators, so it is two sides of a comparison rather than a controlled test. It is the one finding here that is about who is publishing rather than what is published.
Everything above comes from a single sweep on a single pair of days, and every figure is stated with the number it is counted over. The rest of the research takes the same read-out apart along the other axes: how growth was measured, how long the videos ran, when the break arrived and which niches held anything at all.
How this was measured
Discovery ran on 15 September 2026: 36 search.list calls against the YouTube Data API, three content phrasings for each of twelve content classes. That returned 302 unique channels. A mechanical filter — 40 or more uploads, 5,000 or more subscribers, under 60 months old — left 35 candidates.
Each candidate was taken apart upload by upload. Uploads under 28 days old were excluded, because they have not finished collecting views. Shorts of three minutes or less were counted separately from long form. The outlier multiplier for an upload is its views divided by the median views of its neighbours in the same format bucket, which measures a video against its own channel rather than against YouTube. The trailing form, which divides by the previous ten uploads only, is the primary measure, because it divides by uploads that already existed when the video was published; the centred form, which divides by the ten before and the ten after, is a secondary reading and is biased against early uploads.
Three phrasings per class is thin. Two classes were re-swept with fresh phrasings and both changed their answer, so a class with no qualifying channel is under-sampled rather than empty. Subscriber counts are a single snapshot. Click-through, retention and revenue are not public for any channel launchtube does not own, so no figure on this page states them.
The growth histories on this page were rebuilt afterwards from three public sources: archived copies of the channel pages, the public most-replayed heatmap and dated comment timelines. Archive coverage is uneven — 38 snapshots for one channel, two for others, and three of the eleven were never archived at all. Where there are no archives there is no history.
Archived subscriber counts are YouTube’s own three-significant-figure display strings, accurate to about half a per cent, and the milestone dates between two snapshots are interpolated rather than observed. One channel’s public catalogue turned out to be truncated, with roughly fifty early uploads missing, and every figure drawn from it was withdrawn rather than softened. The recomputed multipliers reproduced the stored ones to a median absolute difference of 0.003 across 146 videos.
What this page does not show: views accumulate with a video’s age, so every group falls on the decline measure and the magnitudes are overstated even where the direction is right. The eleven channels with reconstructed histories were chosen because they had already peaked, which is a selection effect and is stated as one. Click-through, retention and revenue figures are not public for any channel launchtube does not own, so none appears here.
Questions people ask
Do the fastest-growing faceless channels publish Shorts
Not in this sample. Every one of the four channels growing fastest on 15 September 2026 was publishing pure long form. Sleepy Science Channel had 318 uploads and no Short, ExtinctZoo 150 and none, Deep Sea Relics 58 and none, and Serious History one Short in 62 uploads. That is four channels on one date, and it does not show that Shorts fail.
How soon does a new channel’s first breakout video arrive
On every channel whose history could be reconstructed, the first real break came within the first five uploads. Sleepy Science Channel’s first and third uploads took 151,064 and 383,127 views while it had 53 subscribers or fewer; Serious History’s second took 667,660 at about 2,700 subscribers, and Worlds Before Us’s third took 966,442 at about 12,800.
Does posting more often rescue a channel that is cooling
It did not on the one channel where it could be measured. That channel raised its cadence from 1.17 to 1.79 uploads a week while its views per video fell 90 per cent, over six mature uploads in the cohort. One channel is not a rule, and the data cannot say that cadence never helps.
What share of a channel’s views sits in its single best video
On the eleven channels measured, the broad catalogues held 5 to 8 per cent of their lifetime views in their best video and the one-hit channels held 66 and 83 per cent. The figures run from 4.8 per cent on ExtinctZoo to 83.3 per cent on Nova’s Lab, read on one date.
Were the channels in this sweep growing or declining
All eleven shortlisted channels were past their per-video peak, falling between 54 and 91 per cent from peak quarter to latest. They were selected for being at their peak, so that decline is partly regression to the mean. Among the generated channels off the shortlist, one in four was at its peak when it was measured.
Does any of this predict what a new channel will do
No. This is a description of channels that already existed on 15 and 16 September 2026, measured only on channels that had already succeeded. Nothing here is a forecast of subscribers or views, and no figure on this page states click-through, retention or revenue, because none of those is public for a channel launchtube does not own.
Sources and further reading
What this page is built from
- 17a — proof-channel sweep read-out — 302 channels discovered, 35 through the filter, 12 content classes
- backtrack read-out — growth histories rebuilt from archived channel pages, replay heatmaps and comment timelines — 11 channels, an 80-page archive cache, 306 comments on one channel
- renorm read-out — the three multiplier normalisations, the recluster and the cold-start recompute — 146 uploads recomputed, median absolute difference 0.003
- cohort test — presenter-led and real-footage channels against generated ones, age-matched — 63 channels in three groups
- adversarial review of the shortlist — twelve ranked objections, each verified against the CSVs — 12 objections
- 17a — selection report, what the evidence settles after four recomputes — measurement rules P18-P25
- model-set read-out — one company-run channel scored against individual creators in the same niche — one company channel, named creators in one niche
The authorities this page draws on
- Wayback Machine — the archived channel pages every growth history was rebuilt from Internet Archive
- YouTube Data API v3, videos.list — the public statistics every figure here is counted from Google for Developers
- YouTube Data API v3, search.list — the call the 36 discovery queries were made with Google for Developers
- Top ways to ensure your content performs well in Google’s AI experiences Google Search Central, last updated
About this research
launchtube runs and publishes this research itself. It is one company's measurements of public YouTube channels, taken on a stated date with a stated method, and it is written by launchtube rather than by any named individual. Where a number cannot be traced to a file it is removed, not softened, and where the data cannot answer a question the page says so.
Every research page, and what launchtube does with it.
Add launchtube as a preferred source in Google